Comprehensive Insights with Analytics
The Boosty Cart Drawer app provides you with a comprehensive set of analytics to track the performance of your cart drawer and measure its impact on your store’s conversions and revenue. Here’s a breakdown of the key metrics available:
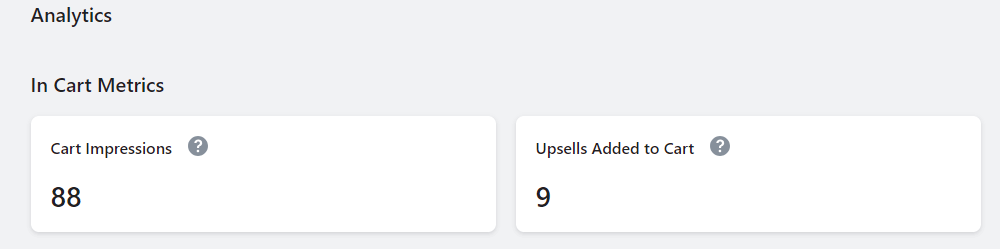
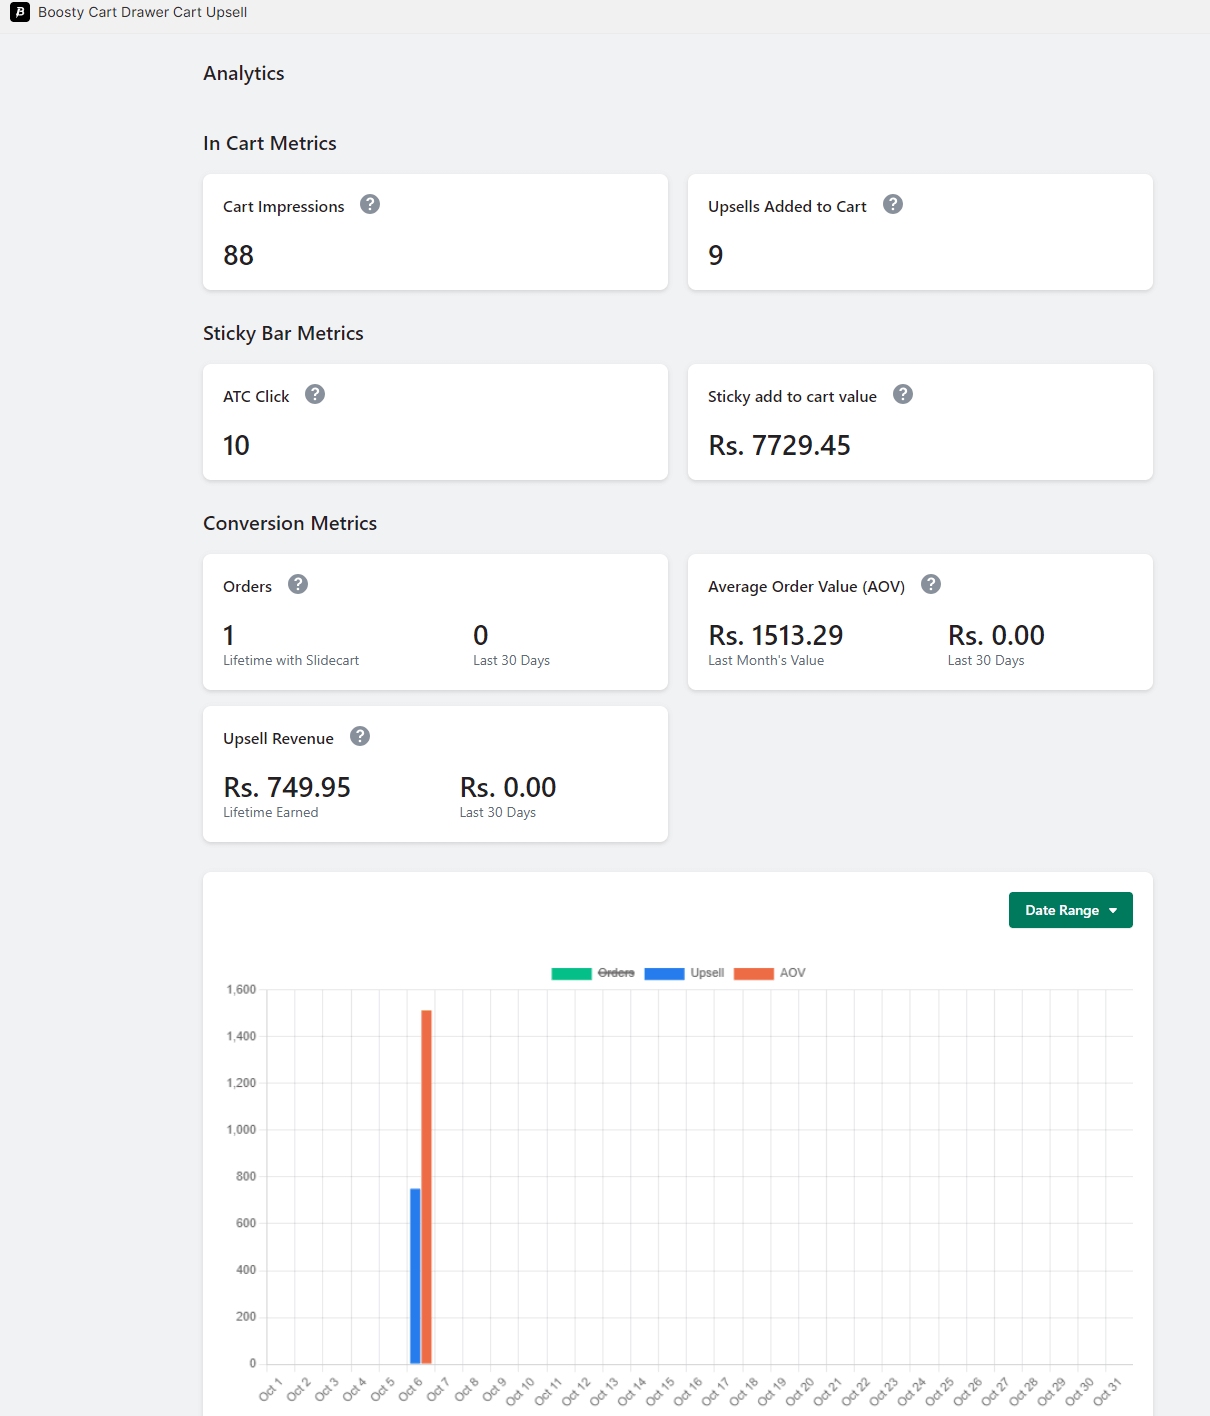
In-Cart Metrics
1. Cart Impressions
View the number of times the cart drawer appears in your store. This metric provides insights into how frequently users interact with the cart drawer.
2. Upsells Added to Cart
Track the number of upsell products added to the cart. This metric helps measure the effectiveness of upselling strategies.
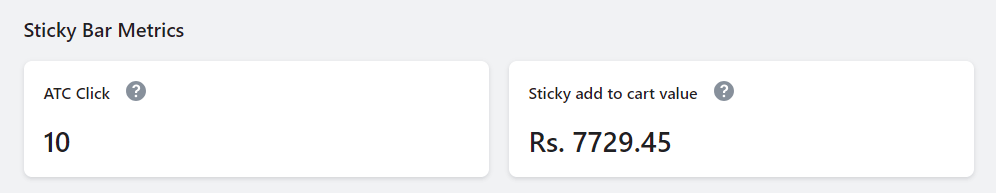
Sticky Bar Metrics
1. ATC Click
Monitor the number of times buyers click the Add to Cart (ATC) button within the sticky Add to Cart section. This metric reflects user engagement with the sticky Add to Cart feature.
2. Sticky Add to Cart Value
Calculate the total order value generated by the sticky Add to Cart. This metric provides insights into the revenue generated through the sticky Add to Cart functionality.
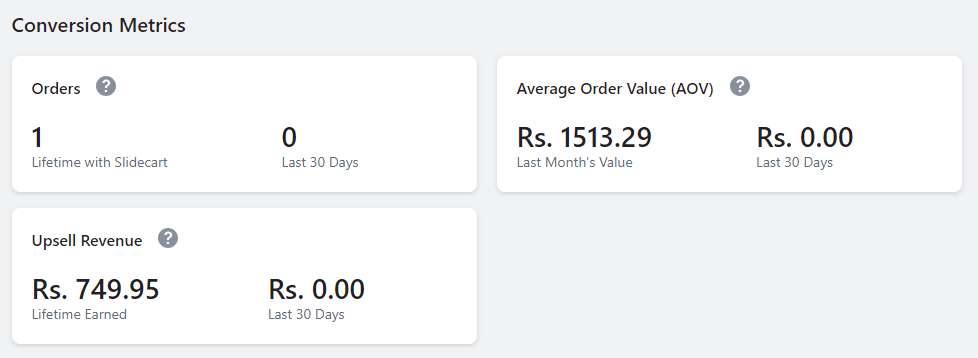
Conversion Metrics
1. Orders
1. All Time
View the total number of orders generated by the app throughout its existence.
2. Last 30 Days
See the total number of orders generated by the app within the last 30 days.
2. Average Order Value (AOV)
1. All Time
Calculate the average order value from the cart drawer throughout the app’s existence.
2. Last 30 Days
Determine the average order value from the cart drawer over the last 30 days.
3. Upsell Revenue
1. All Time
Track the upsell revenue generated using the app over its entire existence.
2. Last 30 Days
Monitor the upsell revenue generated using the app within the last 30 days.
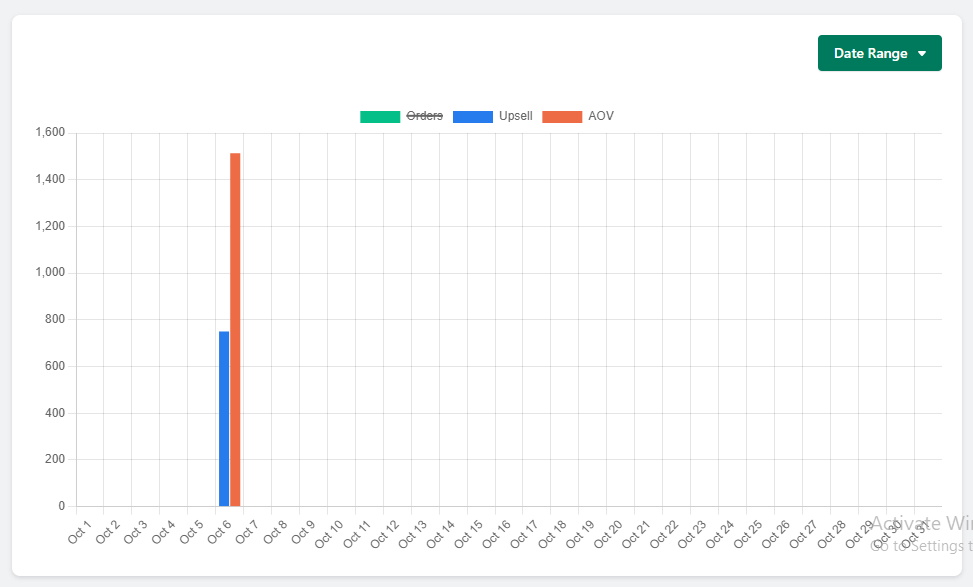
Viewing Conversion Metrics Data
You can view the conversion metrics data in a chart format, providing a visual representation of the performance trends.
How to Customize
Access the Analytics:
Navigate to your app dashboard.
Locate the “Analytics” section within the menu.
Explore Metrics Data:
Review the provided metrics data to gain insights into the performance of the app feature.
Analyze Conversion Metrics Chart:
Explore the conversion metrics chart to visualize trends and patterns in key performance indicators.
With these analytics options, you can track and analyze important metrics related to the usage and effectiveness of the app feature. Use the insights gained to make informed decisions and optimize the performance of your online store.


